utils.LDCPlotter#
- class utils.LDCPlotter(runs: dict | str | Path | list)[source]#
Bases:
objectPlotter for lid-driven cavity simulation results.
Handles both single and multiple runs for comparison using HDF5 files.
- Parameters:
Examples
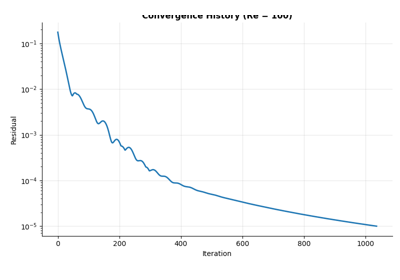
>>> # Single run
>>> plotter = LDCPlotter('run.h5')
>>> plotter.plot_convergence()
>>> # Multiple runs with labels
>>> plotter = LDCPlotter([
...     {'h5_path': 'run1.h5', 'label': '32x32'},
...     {'h5_path': 'run2.h5', 'label': '64x64'}
... ])
Methods
__init__Initialize plotter and load data.
Plot convergence history using seaborn.
Plot pressure field using matplotlib tricontourf.
Plot velocity components using matplotlib tricontourf.
Examples using
utils.LDCPlotter#- plot_convergence(output_path: Path | str | None = None, show: bool = False)[source]#
Plot convergence history using seaborn.
Automatically handles single or multiple runs using hue.